

TL;DR
RIS has stayed below the sample p90 threshold for 64 consecutive sessions.
Transition Score has not re-entered the historical top 5%; it ticked up from October’s floor but still reads as a normal-range stress gauge.
2Y β remains the holdout: the rolling level moved further from baseline, but for how much longer?
In Foundations Check-In: October 2026, we asked whether RIS would stay below p90, whether deviation percentile would keep recovering, and when the 2Y exponent would reverse after RIS and TS normalized. One month later, nearly all of those conditions have improved. The 2Y exponent remains the holdout, and the one we're watching most closely.
Let’s get an update on how those readings have evolved since October, and what they imply for the conditions we described last month.
Novara Research now publishes Bitcoin Research data. Get started today!
November 4, 2026 @ $80,105 (p16.6):
Research as of: 11/04/2026
Bitcoin remains ~47% discounted relative to its implied path (~$151,290). Eight months have now passed since we initially wrote about this price regime (Don’t be surprised this year). Eight months later, Bitcoin remains in a historically deep discount zone.
Daily Drift Diagnostics (2026-11-04)
Exponent: 5.5643 (−0.086%): trend below our central anchor.
R²: 0.9439 (+0.001%): strengthening above our model baseline.


Despite an extended short-term trend below the central power-law attractor, Bitcoin’s scaling relationship remains intact (structural integrity).
Regime progress table (November update)
Introduced in our June check-in and updated each month, here’s the latest.
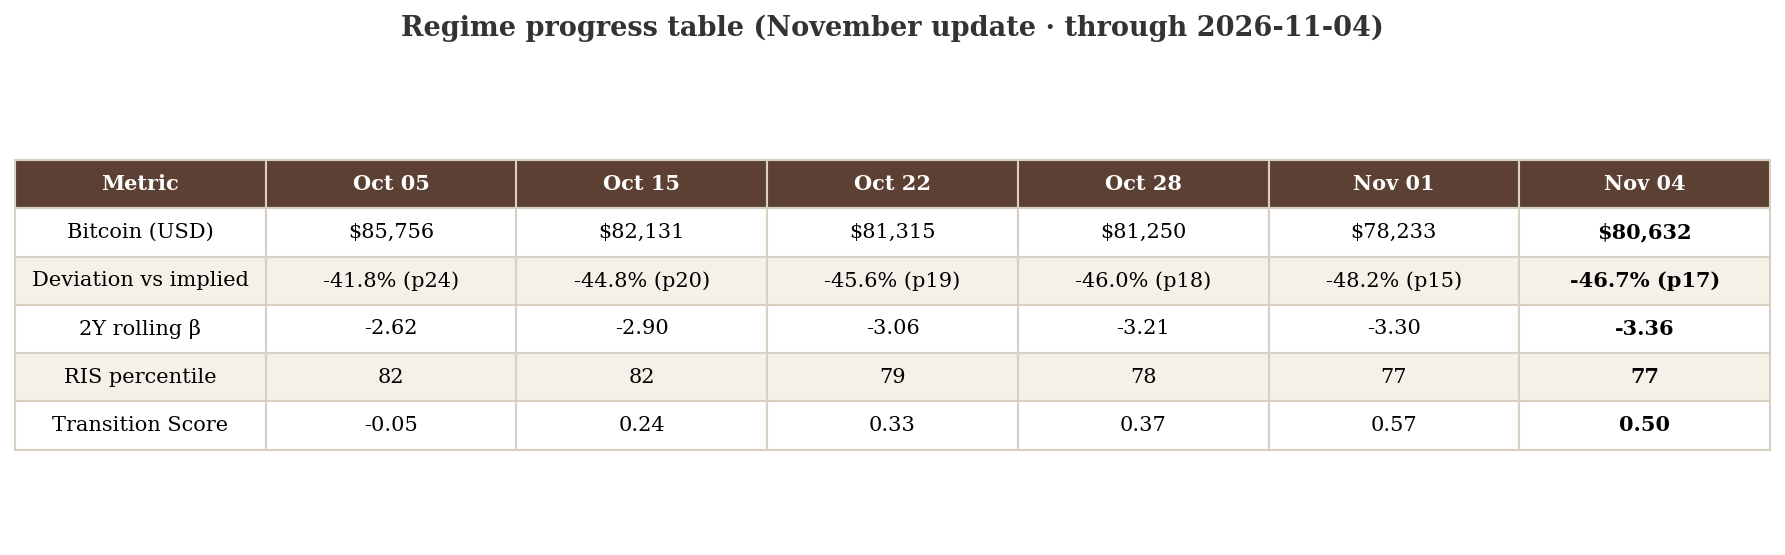
October saw a backslide from ~$86k, with price deviation percentile falling into the low twenties alongside it. By month close, price had come down to ~$77k and back in the p15 zone we have been familiar with since earlier this year. Today's price marks a modest recovery from October's closing lows.
RIS and TS stayed on the normalized path October described:
RIS percentile: 83 → 77. Still below p90; no re-entry signs.
Transition Score: still sub–top-5%. TS has begun climbing again, roughly doubling from last month's reading.
2Y β did not follow price or instability normalization: −2.56 → −3.36. The trailing fit still reads stressed until the β turn occurs.
RIS: nine weeks below p90
A quick update here: RIS has remained under p90 and continues to stabilize.
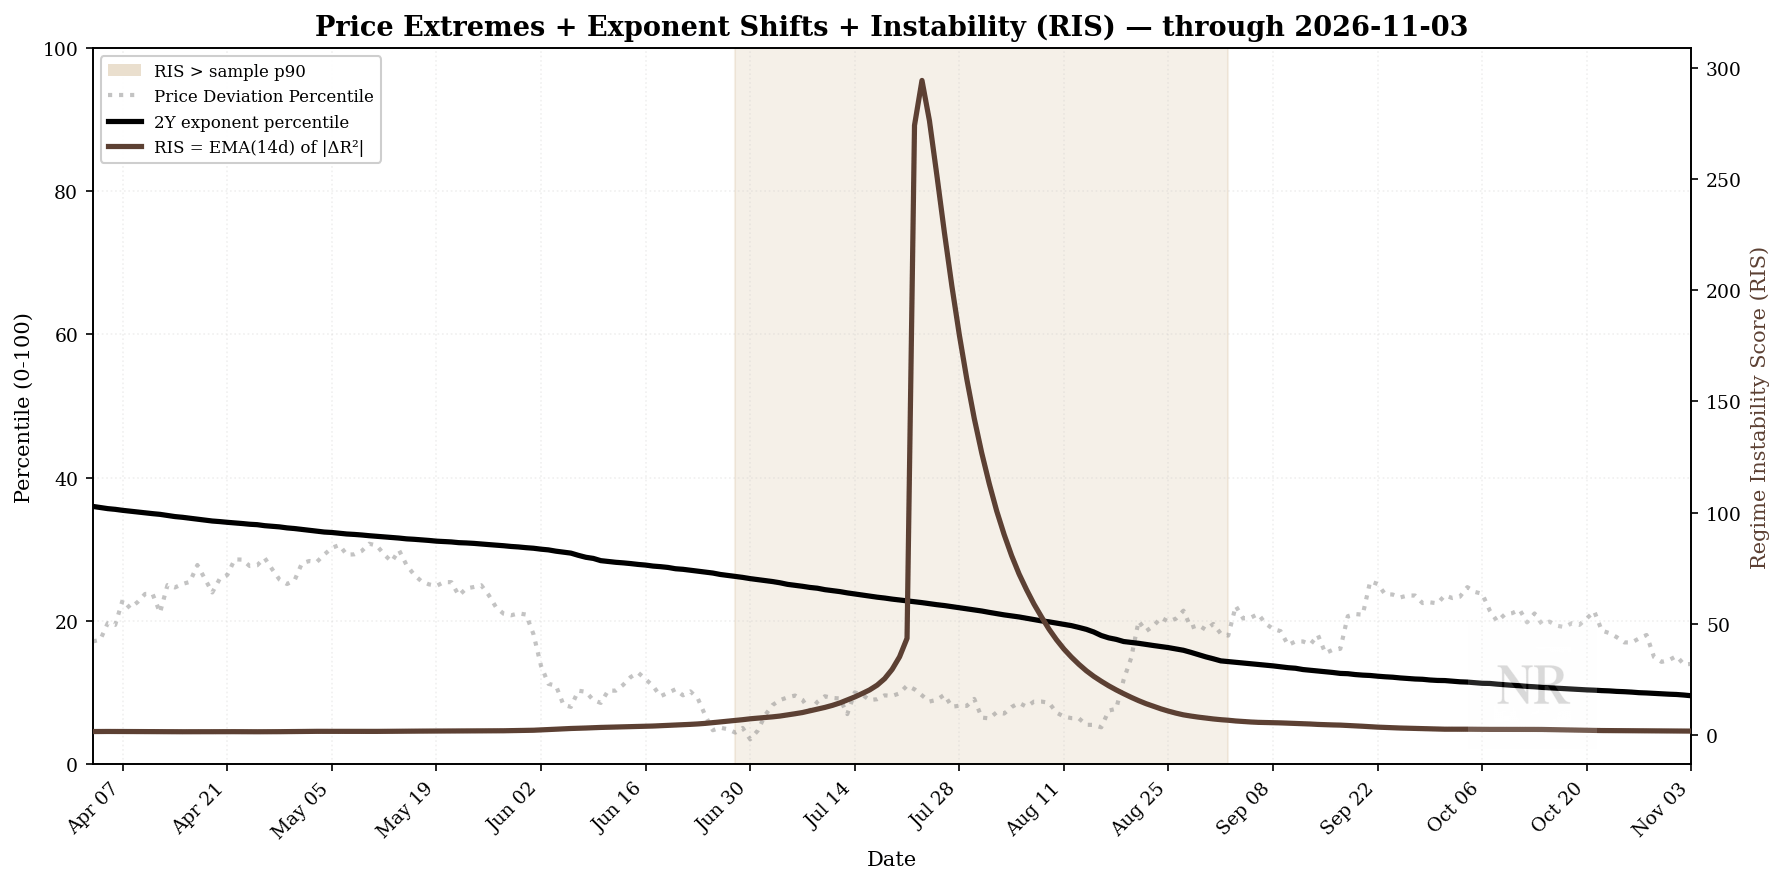
The tan-shaded p90 zone sits in the rearview: the instability leg that opened in late June released and stayed released. With that release, the data resembles the “quiet valley” we introduced in September.
Prior cycles show RIS can re-accelerate if 2Y fit stress returns. But that doesn't appear to be the configuration we're seeing today. RIS is not warming up, and we’re still watching the 2Y β level as the lagging risk.
Transition Score: normalized, but increasing
October left TS near 0.01, far from the 9.61 July 22 peak. The follow-up was whether sub-threshold readings would persist or re-accelerate into the historical top 5%.
They persisted — and rose modestly without crossing the threshold.
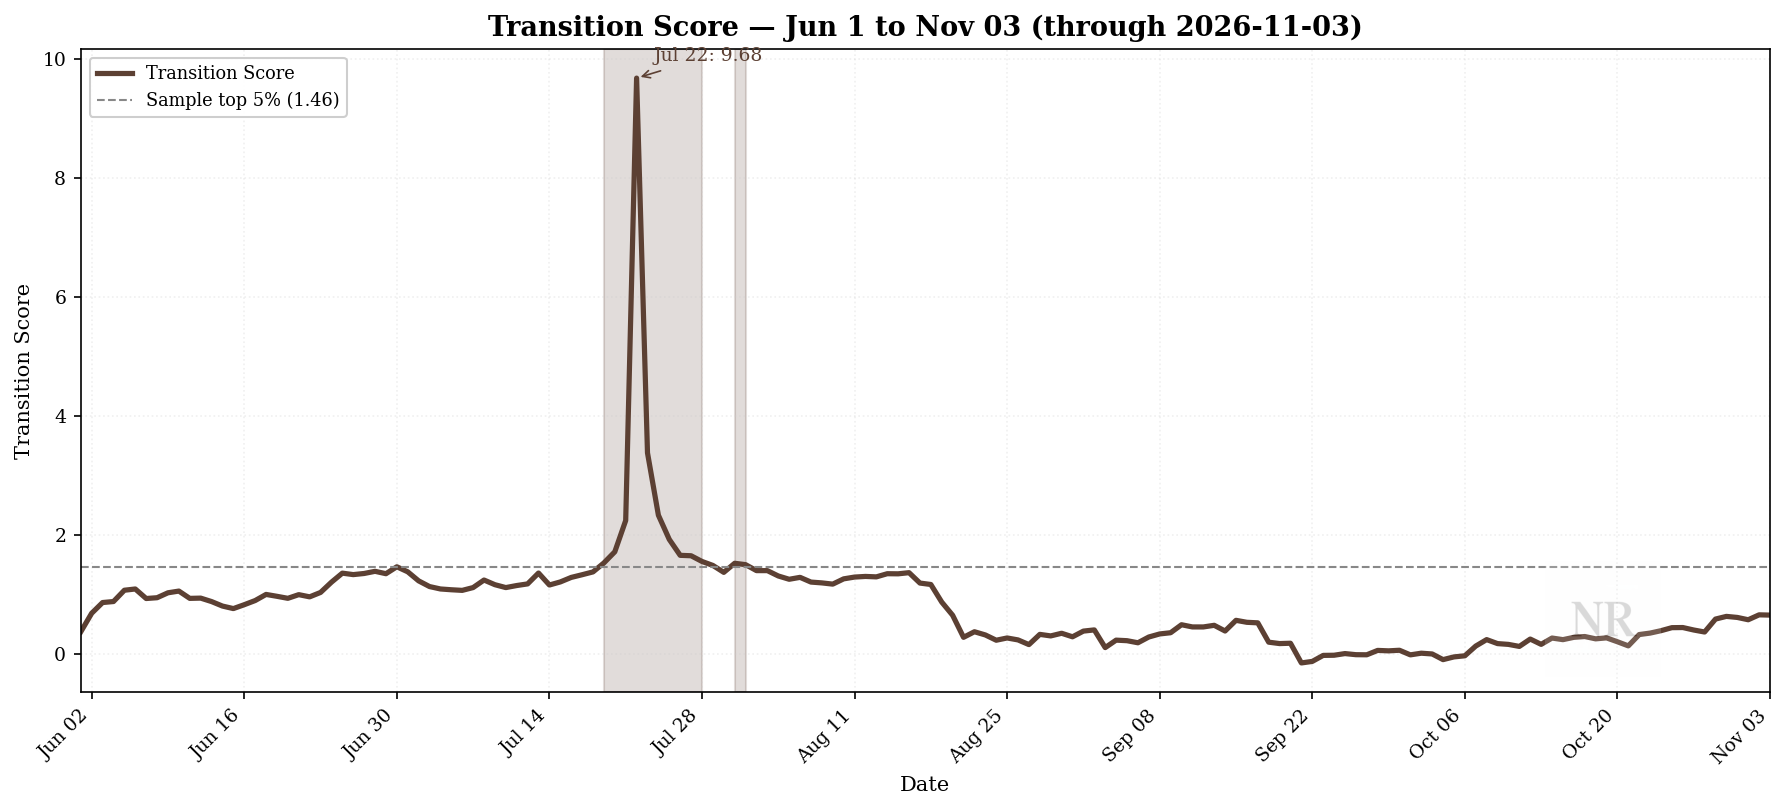
June: TS breaks above 0.25, and will stay elevated before July’s peak.
October: TS back near 0.01, before starting a climb.
November: TS steady rising into ~0.66.
For perspective, today's TS is trending upward but remains far removed from July's extremes. We're no longer at the floor, either. Given the longer-term pattern, this could be a shorter valley. Early signs of TS heating up may point toward renewed 2Y instability, similar to what we observed in July and August. It's too early to tell, but worth watching.
2Y exponent: repair still pending
October left one item open: when 2Y β would turn at the level after RIS and TS normalized. A month later, the level has not, however daily drift metrics are becoming constructive.
Since the October article:
2Y β: −2.56 → −3.36. The rolling 2Y exponent moved further from baseline, not toward repair.
2Y β daily drift: +1.10% (p89.4) → +0.80% (p87.2). Drift stayed positive and upper tail; the pace eased slightly.
2Y R² daily drift: +2.62% (p90.6) → +1.72% (p88.2) — trailing-window fit stress still elevated at the close.
The “dance” between RIS, the 2Y rolling window, and price deviation plays out below, with October’s partial price repair and early November’s retracement partially in view.
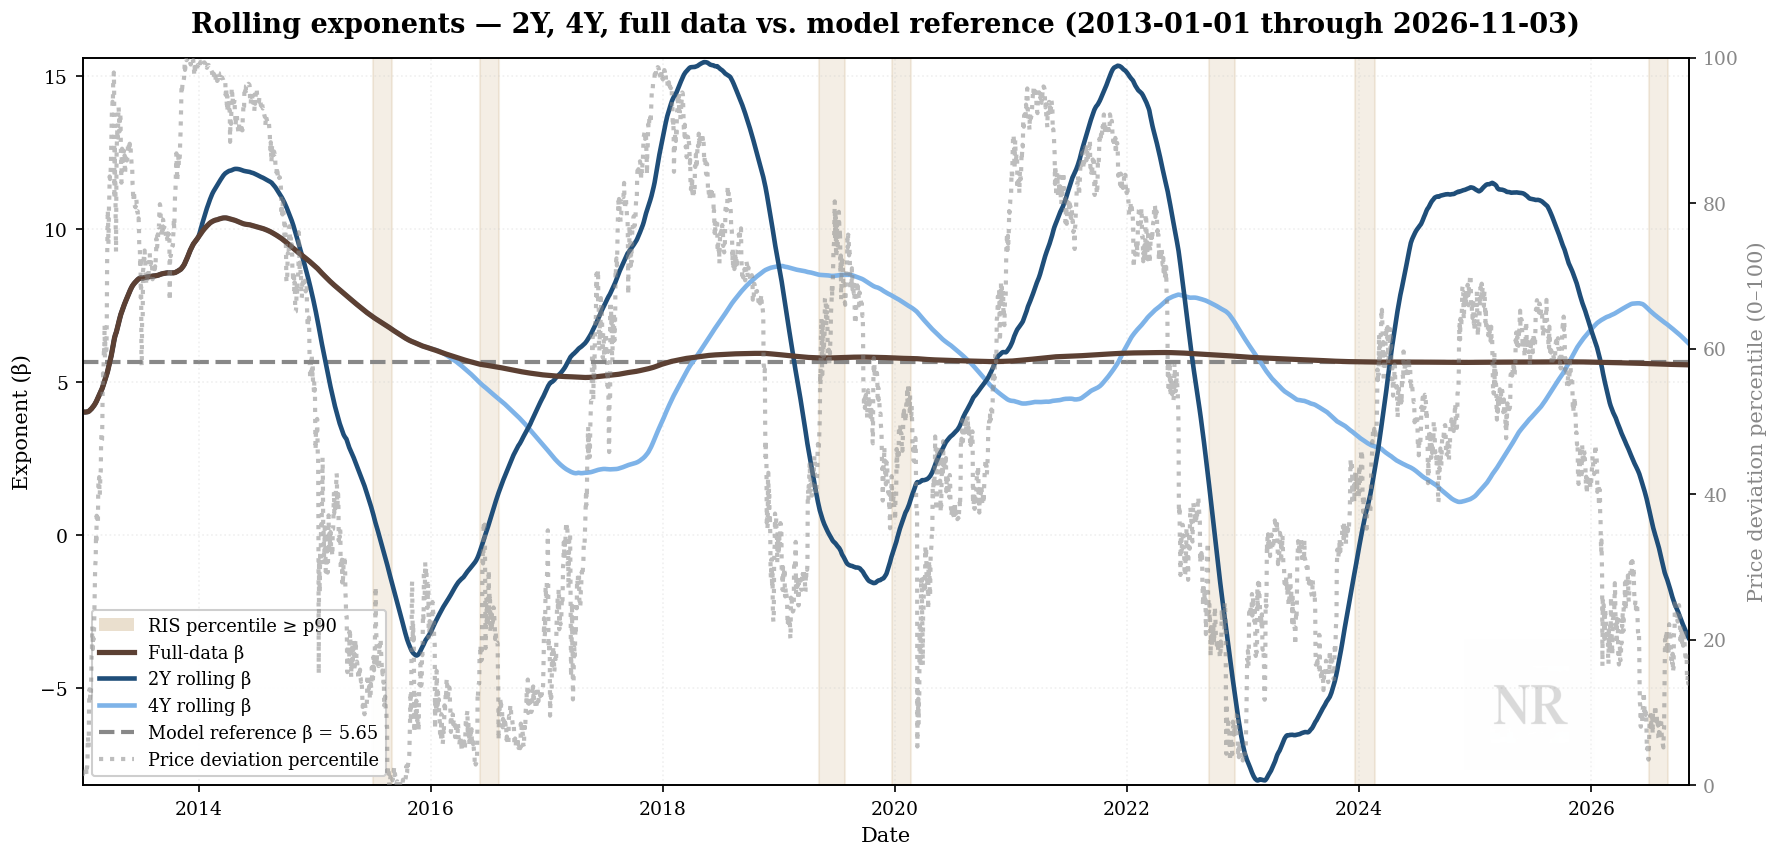
Price deviation percentile on the right rose into early October, then fell back toward midsummer depths, while 2Y β at the level has not followed either leg of that price path.
Tracing the 2Y β through time we can see previous bottoms around -4, -1, and -6. Today, we sit squarely in the center of that range out outcomes. Interestingly, take note that these “bottoms” or “turns” of the 2Y always occur between two short p90 RIS regions. We continue to explore this curious relationship, how it can be helpful in understanding Bitcoins long-term structural integrity, and what this might tell us about price in the future.
Outlook
Things we’re looking out for:
RIS has relaxed, but how long until it starts heating up?
Will the 2Y β reverse the trend by EOY?
Will TS follow suit and peak again before the end of Q1 2027?
Will price appreciate heading into December, and could that help drive us out of the valley?
Does 2Y ΔR² drift stay elevated while β level falls? That pattern would say fit stress is migrating, not disappearing.
Conviction and Patience
Watch the structure and don’t be surprised. Keep on top of our latest research and support our work.
Don’t forget, now YOU can monitor the structure, using real Novara Research data!
Research infrastructure, not financial advice.
Foundations of Conviction
Foundations Check-In: October 2026
Foundations Check-In: September 2026
Foundations Check-In: August 2026