

TL;DR
Bitcoin remains below the p10 threshold.
RIS at p91.2, in its fifth consecutive session above the sample p90 threshold.
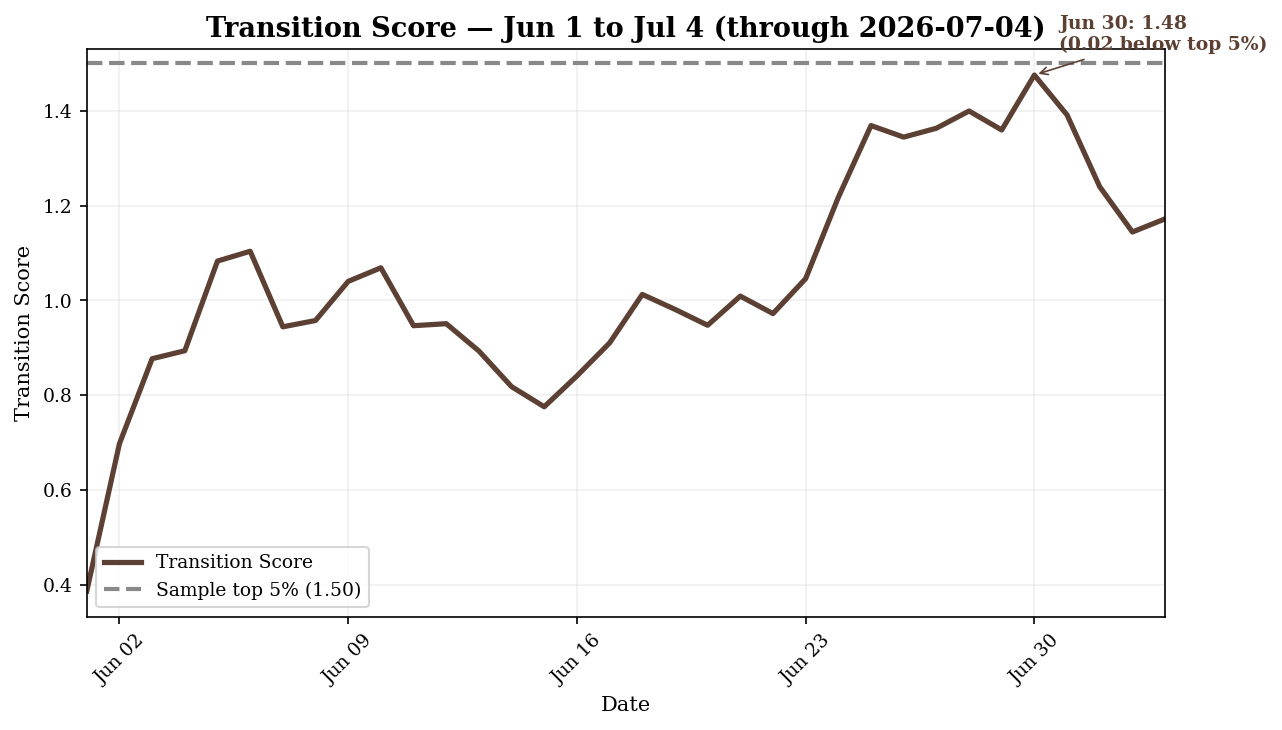
Transition Score reached 1.48 on June 30, just 0.02 below the historical top 5% threshold.
In Foundations Check-in: June 2026, we outlined how we started using RIS, RIS percentile, and Transition Score as the supplementary reads when a deep discount starts to show itself.
Let’s get an update on how those readings have evolved, and what they imply for the conditions we described in June.
Finally, a reminder that you too can start using Novara Research data today.
July 5, 2026 @ $62,394 (p8.0):
Bitcoin remains more than 54% discounted relative to its implied path (~$135,842). Three Four months have now passed since we initially wrote about this price regime (Don’t be surprised this year), and we’re still here!
Daily Drift Diagnostics (2026-07-05)
Exponent: 5.6027 (−0.837%): trend below our central anchor.
R²: 0.9435 (+0.0636%): strengthening above our model baseline


Despite an extended short-term trend below the central power-law attractor, Bitcoin’s scaling relationship remains intact (structural integrity).
Regime progress table (July update)
Introduced in our June check-in, here’s an update to some of the latest supplemental metrics and their track.
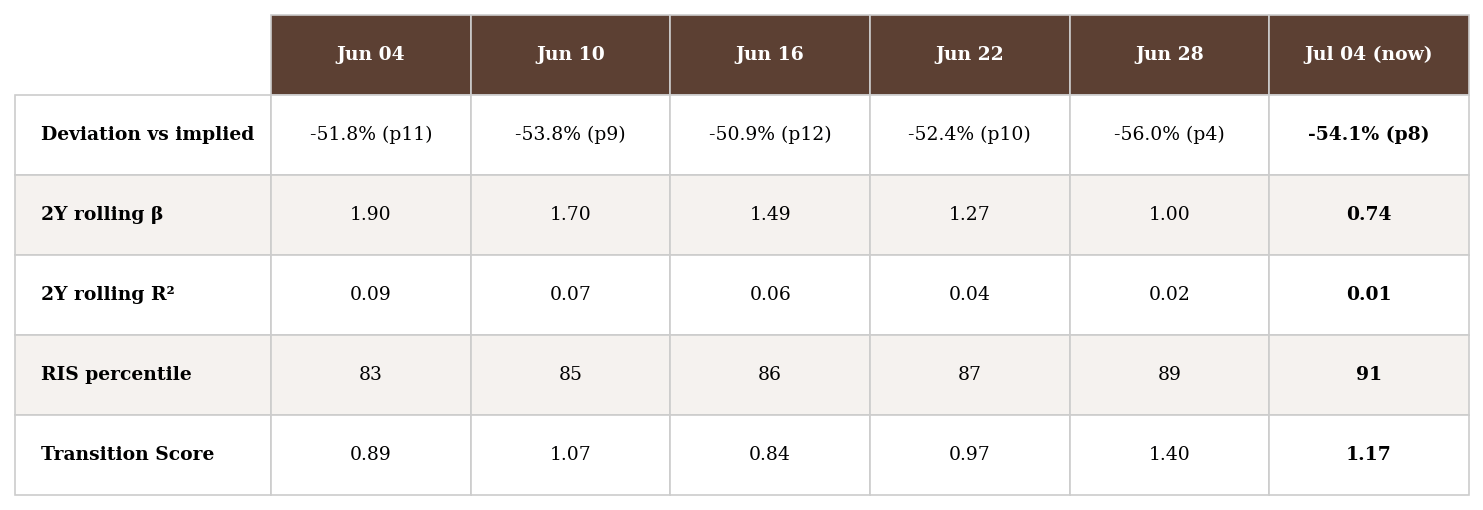
RIS percentile rose from 83 at the June 4 reading to 91 in today’s article. Transition Score moved from 0.89 to 1.17.
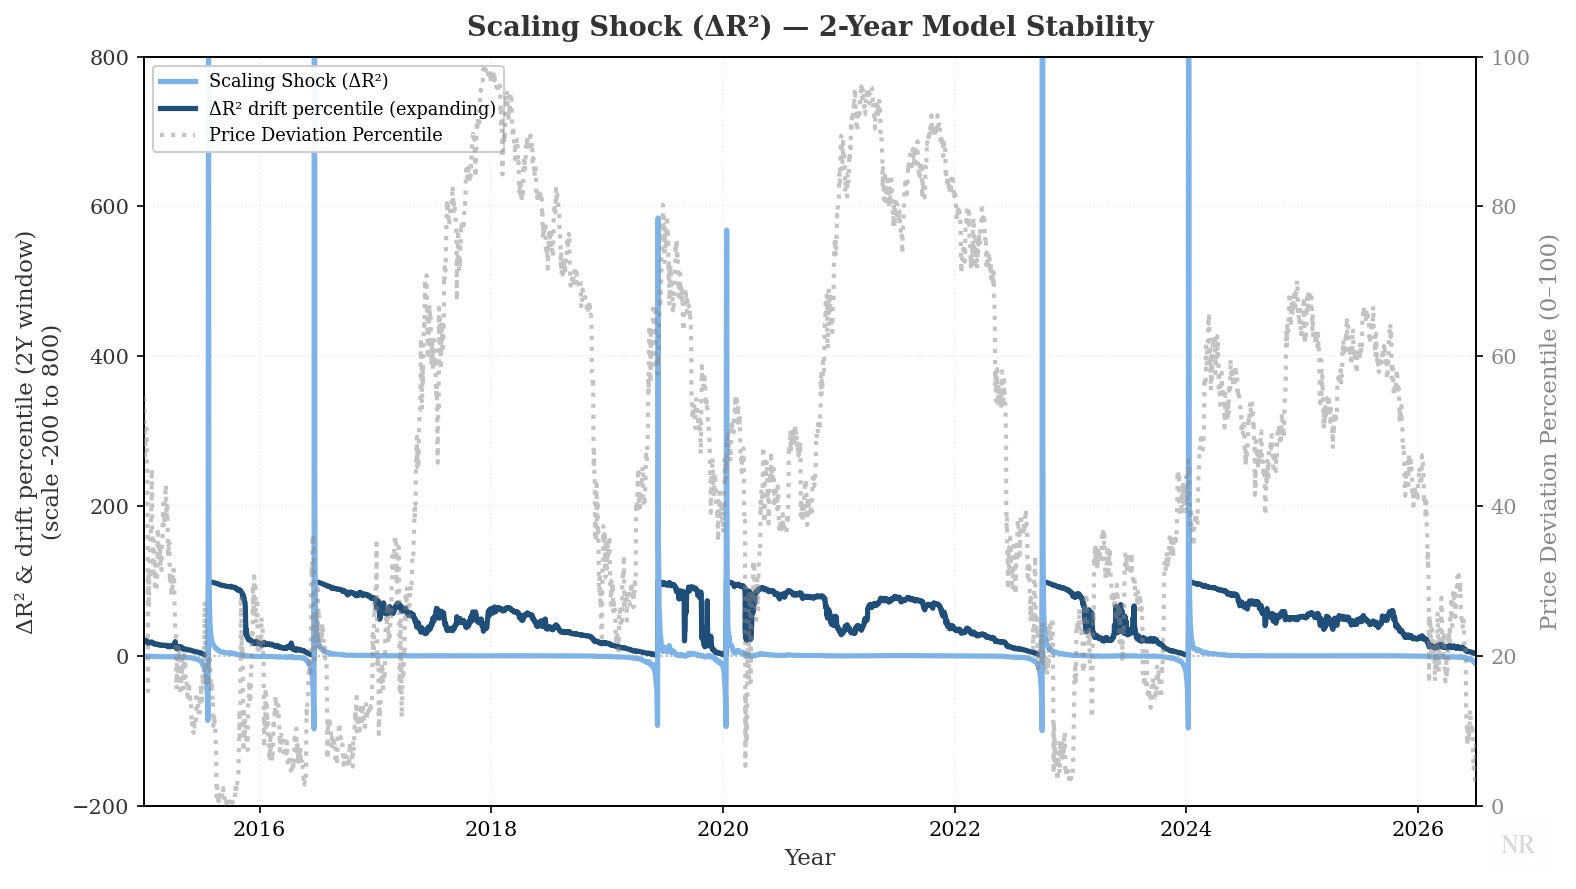
As RIS and Transition Score begin bubbling up, “Scaling Shock” (the more sensitive version of these signals), starts to accelerate away from the X-axis. We have seen this before at key turning points. Here’s a closer look at the 2023 episode:
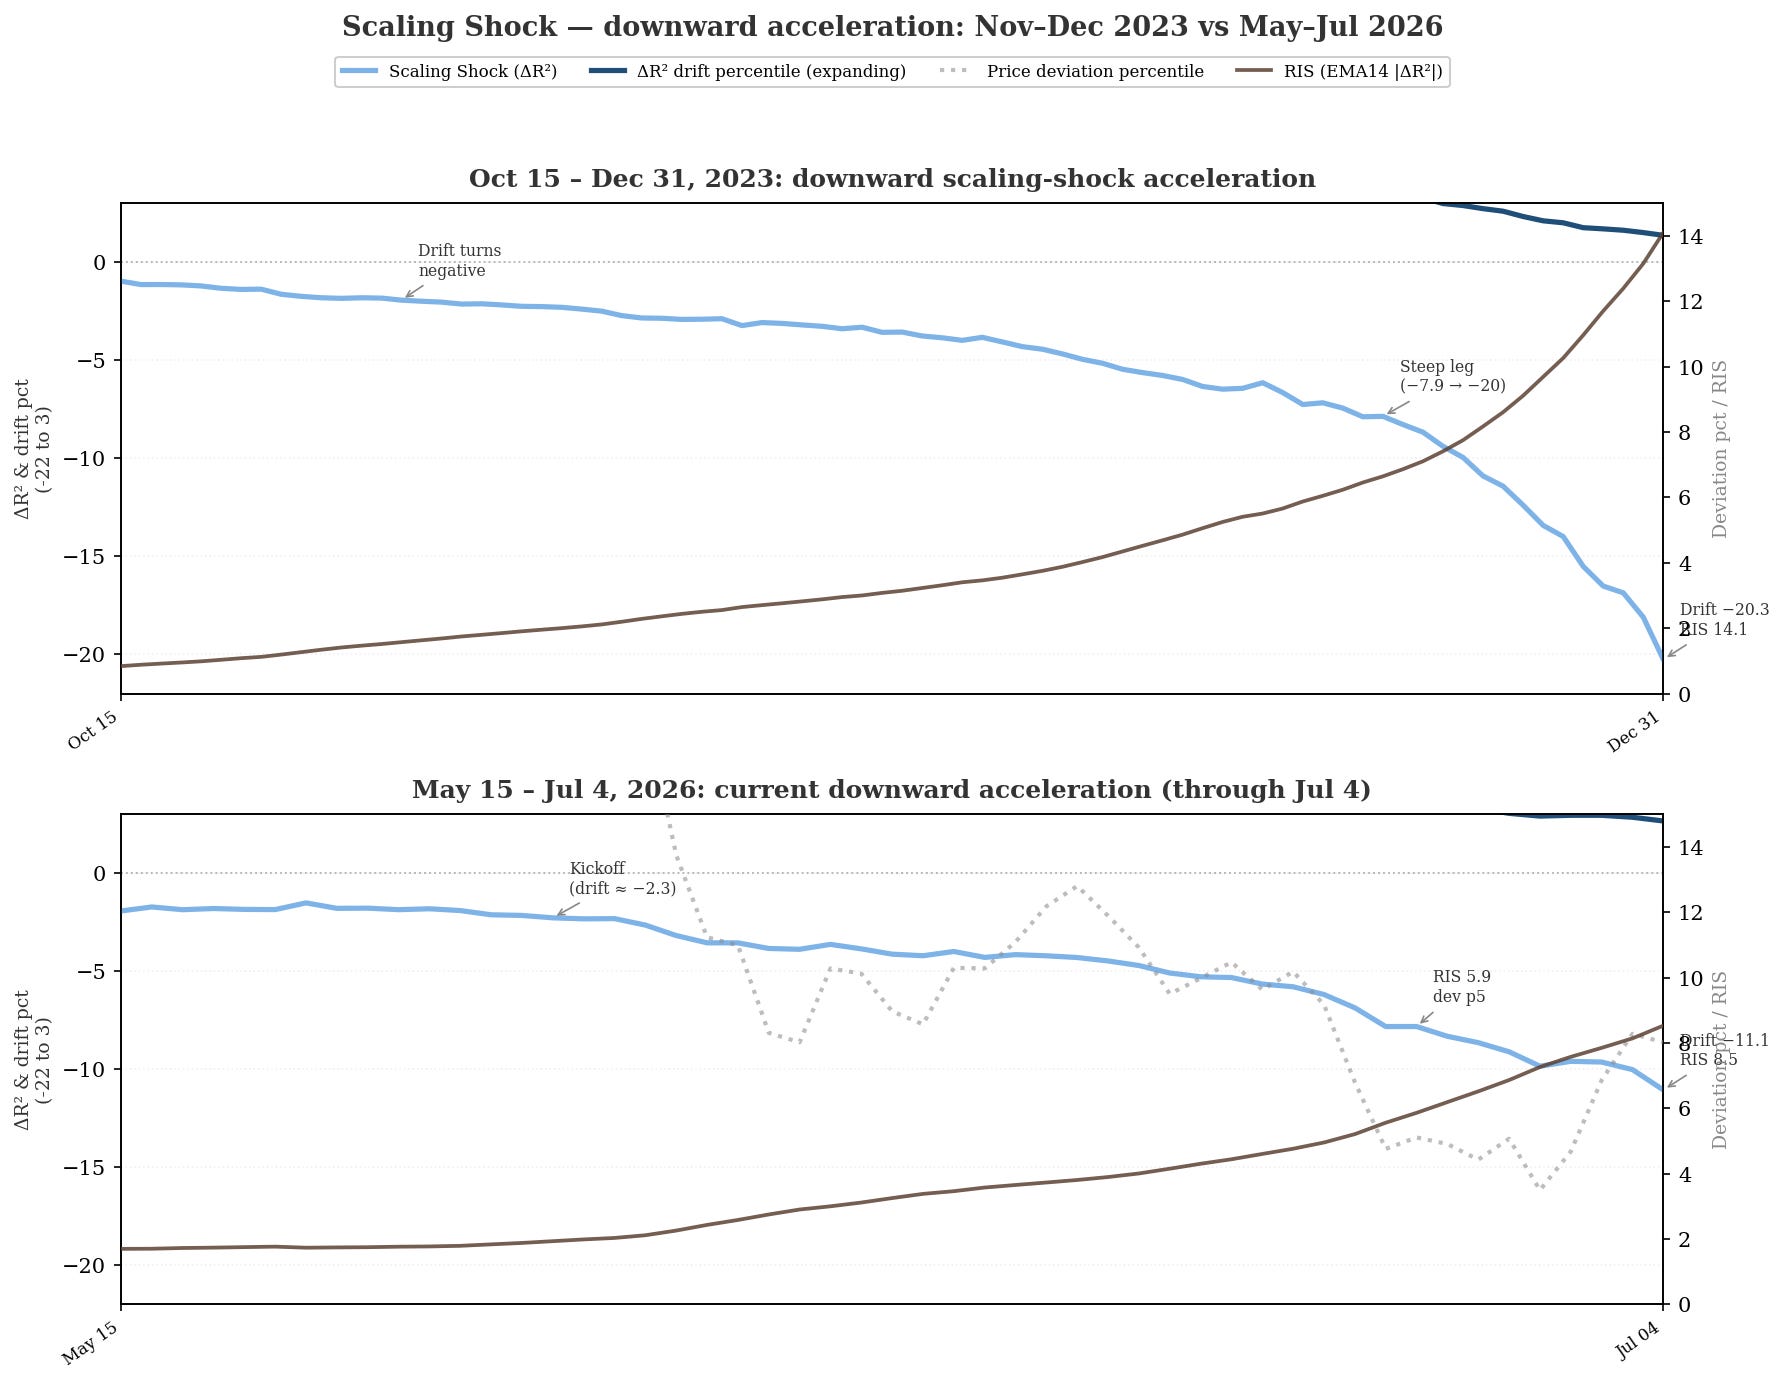
In 2023, price deviation came down weeks later and eventually recovered. At today’s pace, we already experienced the falling price deviation. Does this mean the pain is behind us, or that we have one more drop to the downside?
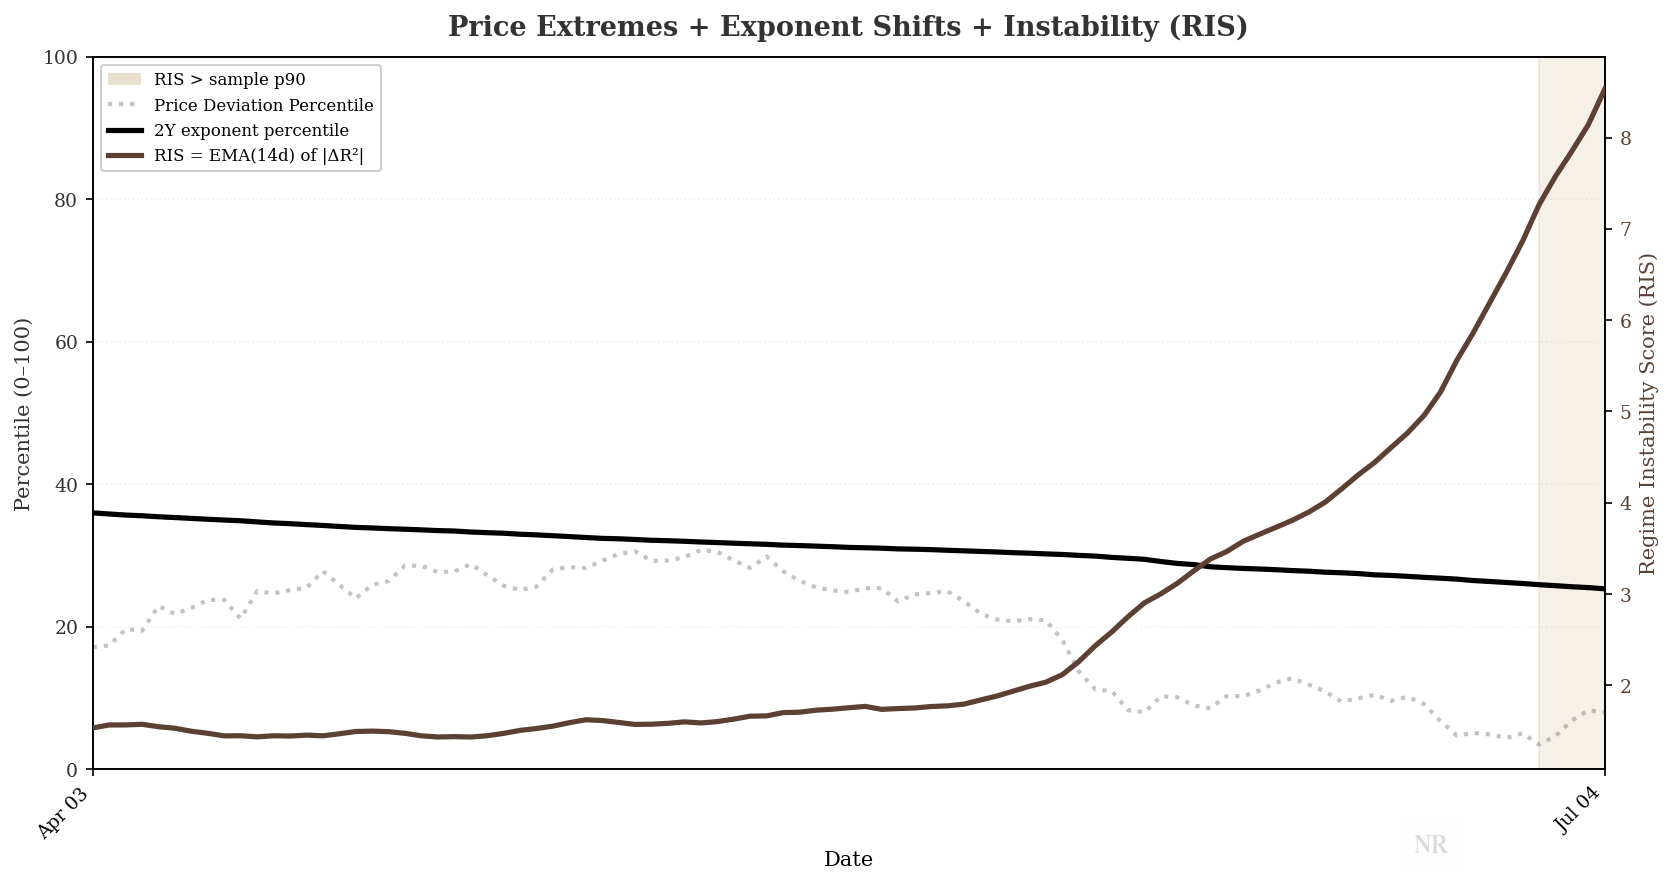
RIS: fifth session above p90
RIS exceeded the p90 threshold on June 30, and has remained above it through July 4.
At the July 4 close, RIS reads 8.53.
Transition Score and the top 5% threshold
In June, we listed TS entering the historical top 5% as a condition to monitor. On June 30, TS came within 0.02 of the threshold: not a cross, but the closest approach of this cycle.
It also looks like TS is trending upwards, might we eventually break into the top 5% range?
Outlook
Building on where we started in June: Conditions highlight ongoing local fit stress, RIS steadily marching upward, and TS testing the upper tail of its historical distribution.
Things we’re looking out for:
How long does RIS stay above the p90 range, and when does it make its turn back down?
Will TS make a cross into top 5%, and what conditions need to exist to push it higher?
How long before 2Y reversal, and how long before 4Y exponent runs under 5.65?
Historically RIS exceeding p90 has created a volatility window 2-weeks later. Will it arrive, and maybe this creates conditions for TS to become more elevated?
Conviction and Patience
Prioritize the underlying structure. Everything else is noise.
Watch the structure and don’t be surprised. Keep on top of our latest research and support our work.
Don’t forget, now YOU can monitor the structure, using real Novara Research data!
Research infrastructure, not financial advice.