

TL;DR
Bitcoin price is at the 18th percentile level, up 9 points from our August check-in.
RIS has finally dropped below the sample p90 threshold, since reaching a peak event in July.
Transition Score reads 0.40, returning back to normal range, down from 1.38 in August and the 9.61 July peak.
In Foundations Check-In: August 2026, we tracked RIS, RIS percentile, and Transition Score through the longest p90+ streak of this cycle. We asked when RIS would turn, whether TS would re-enter the top 5%, and whether the 2Y exponent would reverse.
One month later, two of those questions have clear answers. The third, 2Y trend repair, is still open.
Let’s get an update on how those readings have evolved since August, and what they imply for the conditions we described last month.
Novara Research now publishes Bitcoin Research data. Get started today!
September 3, 2026 @ $81,460 (p22.3)
Bitcoin remains ~43% discounted relative to its implied path (~$143,332). Six months have now passed since we initially wrote about this price regime (Don’t be surprised this year). Price has recovered from the $63k–$66k band we highlighted in August, now trading above $81k, but the discount zone is still deep by historical standards.
Daily Drift Diagnostics (2026-09-03)
Exponent: 5.5811 (−0.069%): trend below our central anchor.
R²: 0.9435 (+0.0006%): strengthening above our model baseline.


Despite an extended short-term trend below the central power-law attractor, Bitcoin’s scaling relationship remains intact (structural integrity).
Regime progress table (September update)
Introduced in our June check-in and updated each periodically, let’s check in on the latest.
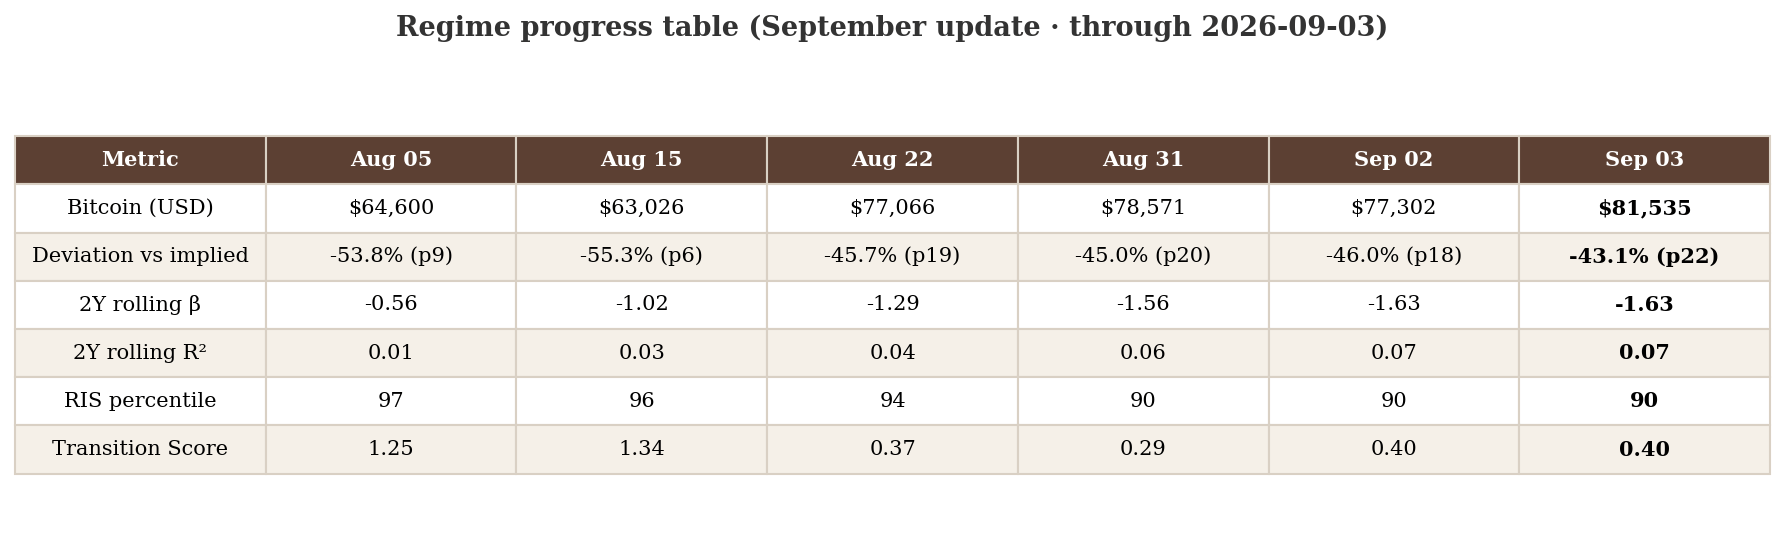
Through the price lens, August and early September have not been boring: Bitcoin moved from sub-p10 territory toward the low twenties on the deviation percentile scale. Underneath the surface, the story we flagged in July and August where RIS and TS returned to historic levels, resolved on schedule, with RIS finally crossing below p90 at the start of September.
RIS: the p90 streak is over
In August we reported 36 consecutive sessions above the sample p90 threshold. At the time, RIS read 80.7 (p97.7), down from the July 23 peak but still firmly in the upper tail. We noted that if RIS kept decaying at its post-peak pace, it could cross back below p90 by mid-September.
That cross happened on the first trading day of September, leaving us with 63 total sessions with elevated readings.
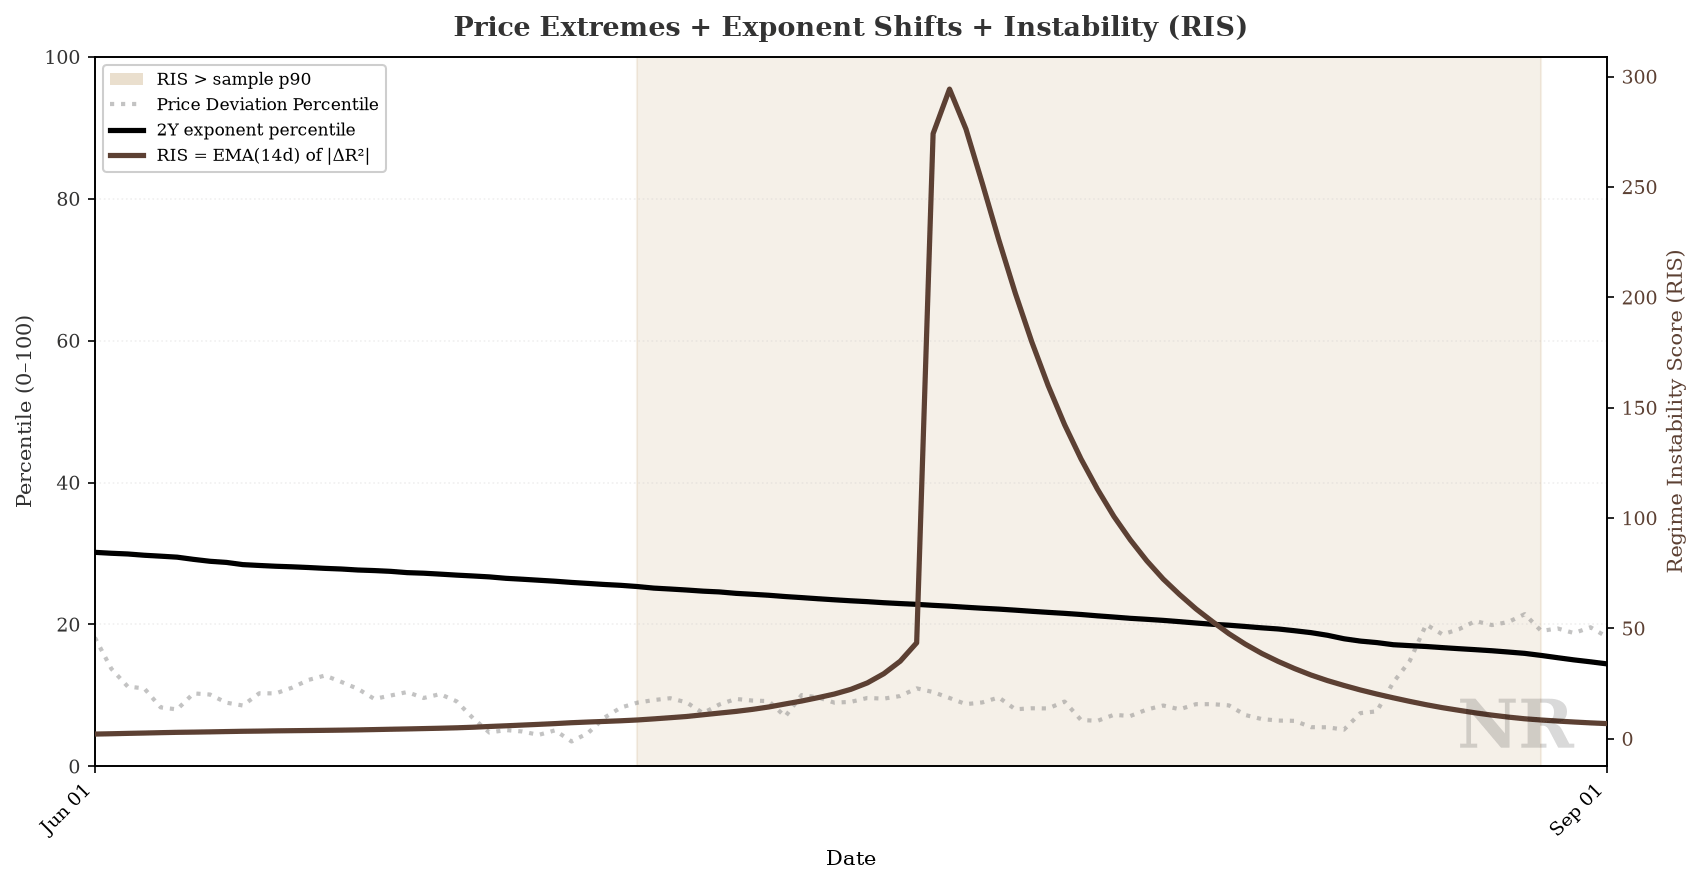
At the Sep 2 pipeline close headline RIS reads 6.6 (p89.6), with two consecutive sub-p90 readings through that date.
We do not treat two prints below p90 as “all clear.” RIS can chop around the threshold during volatile repairs. The direction however is unambiguous: the extended instability episode that began in late June has released, not intensified.
Transition Score: normalized after the July spike
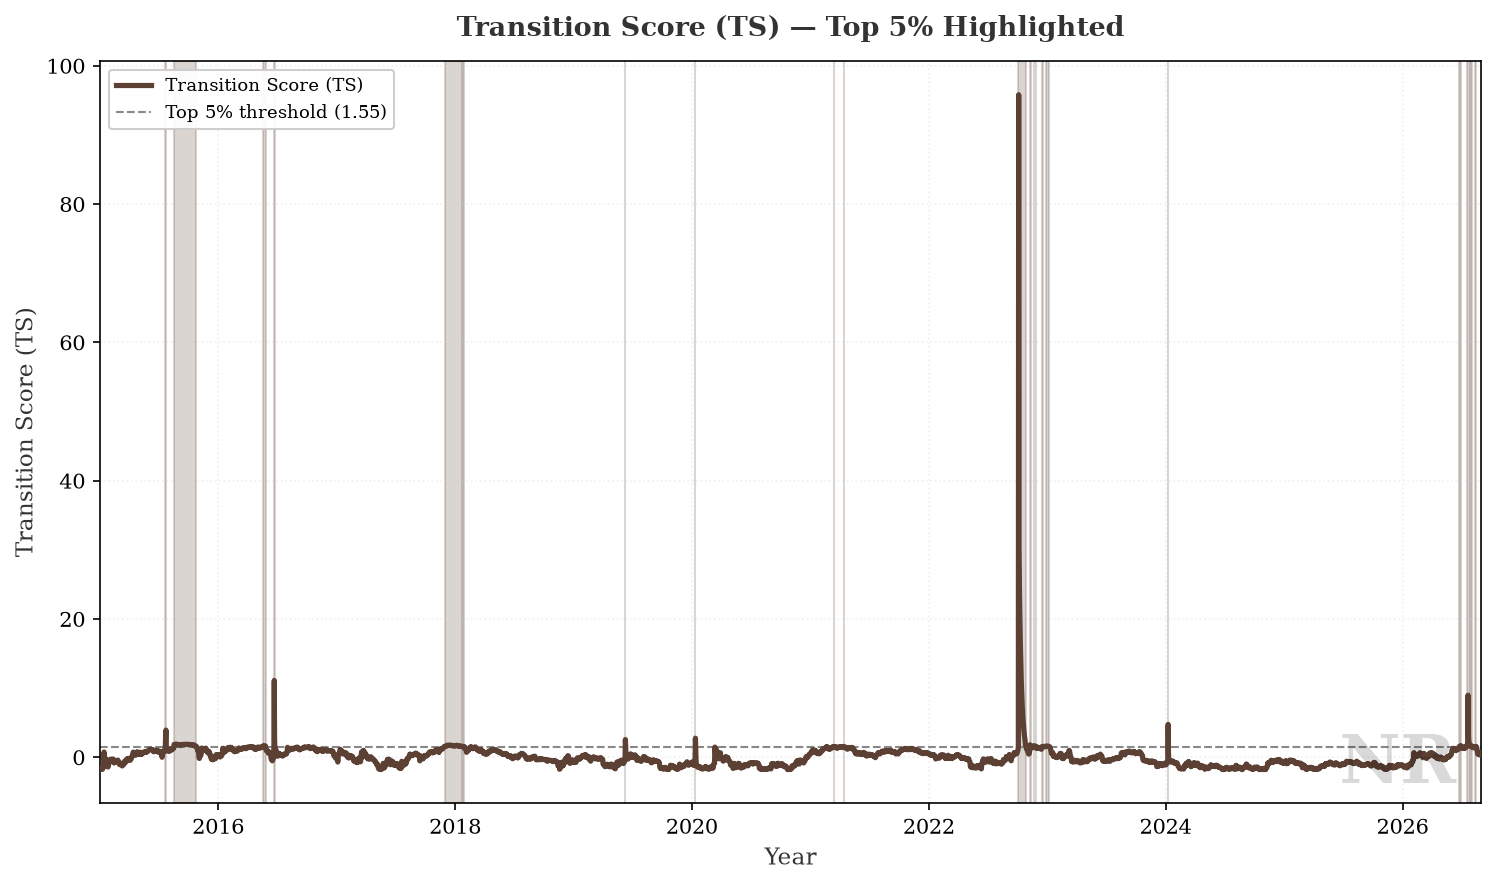
In August, TS had already eased to 1.38, down from the 9.61 peak on July 22, the largest structural-stress reading in the upstream Foundations series. We watched for whether sub-threshold readings would persist or re-accelerate.
They persisted.
At the Sep 2 pipeline close, TS reads 0.40. Far lower than the historical top 5%, and closer to the June baseline (~0.89) than to any July stress reading. The July 19–August 1 window that registered 12 sessions in the top 5% range looks, in hindsight, like the cycle maximum for Transition Score so far.
2Y exponent: repair still pending
The open item from August remains open.
The 2Y β moved from −0.51 (Aug 4) to −1.63 (Sep 2). That is further from model baseline, not closer — even as price percentile recovered and RIS/TS normalized.
The 4Y β at 6.84 continues to plateau above the 5.65 baseline we have watched for an eventual cross. Direction on the longer window has not yet confirmed the shorter-window relief in RIS and TS.
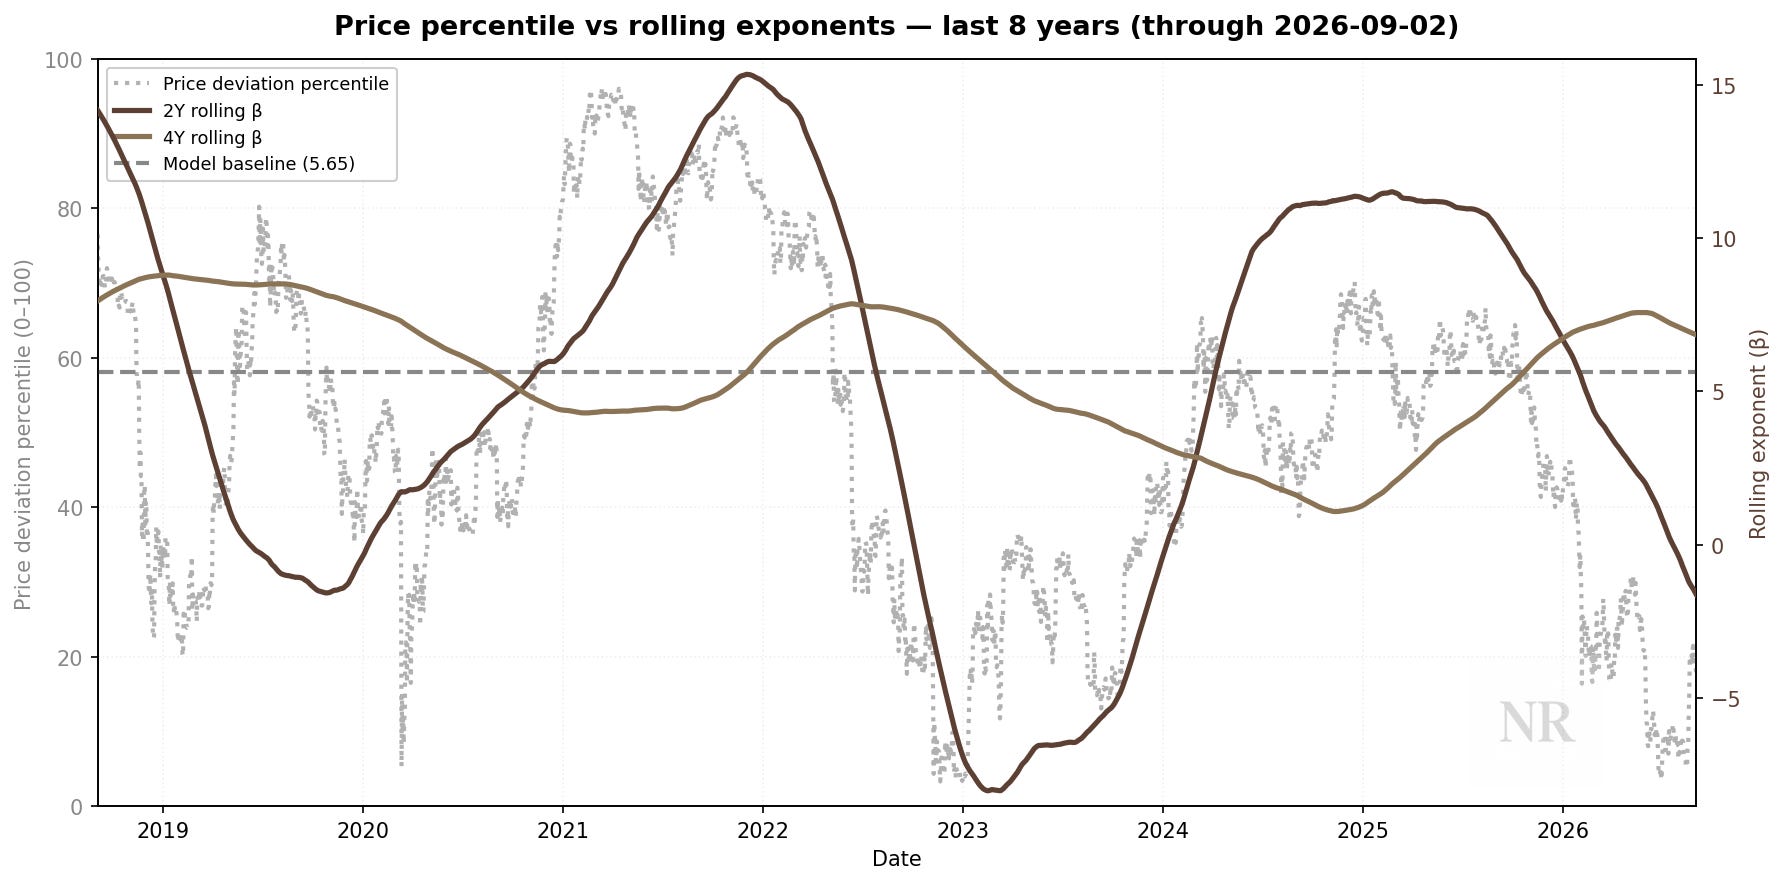
Historically, RIS p90 episodes have coincided with volatility windows; the repair phase sometimes shows up first in instability scores and only later in rolling exponent trend. We may be in that ordering now.
Outlook
Things we’re looking out for:
Does RIS stay below p90? Two sessions below the threshold is progress; four weeks would confirm the June–August episode is behind us.
Does price percentile continue to recover? p22 is better than p9, but still a deep discount. We watch whether deviation repair accelerates with normalized TS.
When does the 2Y exponent reverse trend? RIS and TS have normalized; the 2Y rolling curve has not yet followed. A reversal there would align with prior recovery episodes.
Does TS re-enter the top 5%? Less likely near-term given the 0.40 print, but we keep it on the board if fit stress re-accelerates.
Conviction and Patience
Watch the structure and don’t be surprised. Keep on top of our latest research and support our work.
Don’t forget, now YOU can monitor the structure, using real Novara Research data!
Research infrastructure, not financial advice.
Foundations of Conviction
Foundations Check-In: August 2026