

TL;DR
Bitcoin price is at the 9th percentile level.
RIS has spent 36 consecutive sessions above the sample p90 threshold since late June.
Transition Score crossed into the historical top 5% on July 19 and peaked at 9.61 on July 22, the largest single-day structural stress reading of this cycle.
In Foundations Check-In: July 2026, we followed up on RIS, RIS percentile, and Transition Score to understand the relationship between power law “relative cheapness” and short-term price regime stress. At the time, RIS had just entered the p90 zone, and Transition Score was testing the upper tail without yet crossing the historical top 5% threshold.
One month later, those signals extended, intensified, and in several cases crossed the thresholds we were watching.
Let’s get an update on how those readings have evolved since July, and what they imply for the conditions we described last month.
Novara Research now publishes Bitcoin Research data. Get started today!
August 5, 2026 @ $64,857 (p9.0)
Bitcoin remains more than 53% discounted relative to its implied path (~$139,730). Five months have now passed since we initially wrote about this price regime (Don’t be surprised this year). It’s not too late to give it a read before 2026 wraps up!
Daily Drift Diagnostics (2026-08-05)
Exponent: 5.5909 (−1.046%): trend below our central anchor.
R²: 0.9435 (+0.0636%): strengthening above our model baseline.


Despite an extended short-term trend below the central power-law attractor, Bitcoin’s scaling relationship remains intact (structural integrity).
Regime progress table (August update)
Introduced in our June check-in and updated in July, we have once again revised this table to now include price.
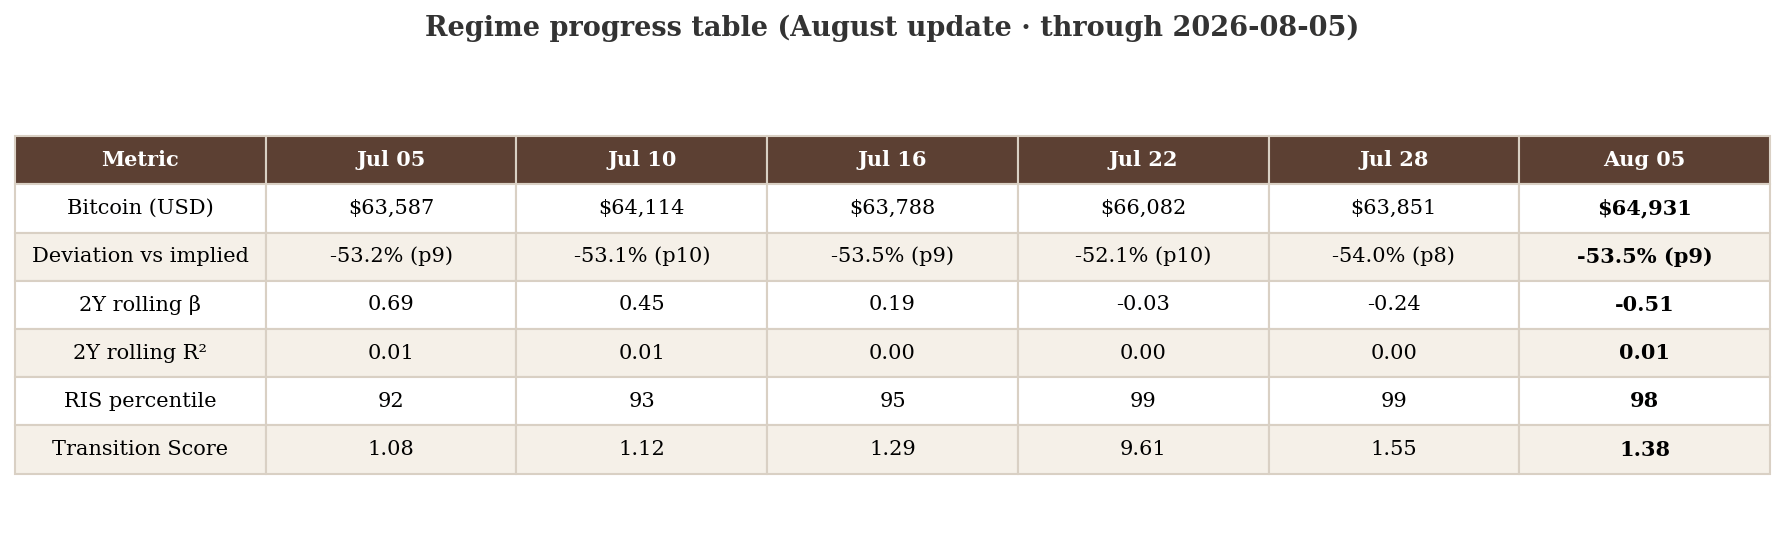
Through just the price lens, July was a boring month where Bitcoin moved in a narrow band of $63k to $66k. Underneath the surface however, the story was slightly different.
In the middle of the month, RIS percentile climbed 95 → 99, the 2Y exponent (β) fell 0.19 → −0.24, and Transition Score spiked to 9.61 mid-period before settling back to 1.55.
With TS almost nearly reverted back to normal levels (more there later), RIS decline is a more prolonged event.
RIS: 36 sessions above p90
In July we reported RIS exceeding the p90 threshold on June 30 and staying elevated through July 4. This set a streak of five sessions represented time spent above the 90th percentile rank. As of our latest data, that streak continues into the day 36.
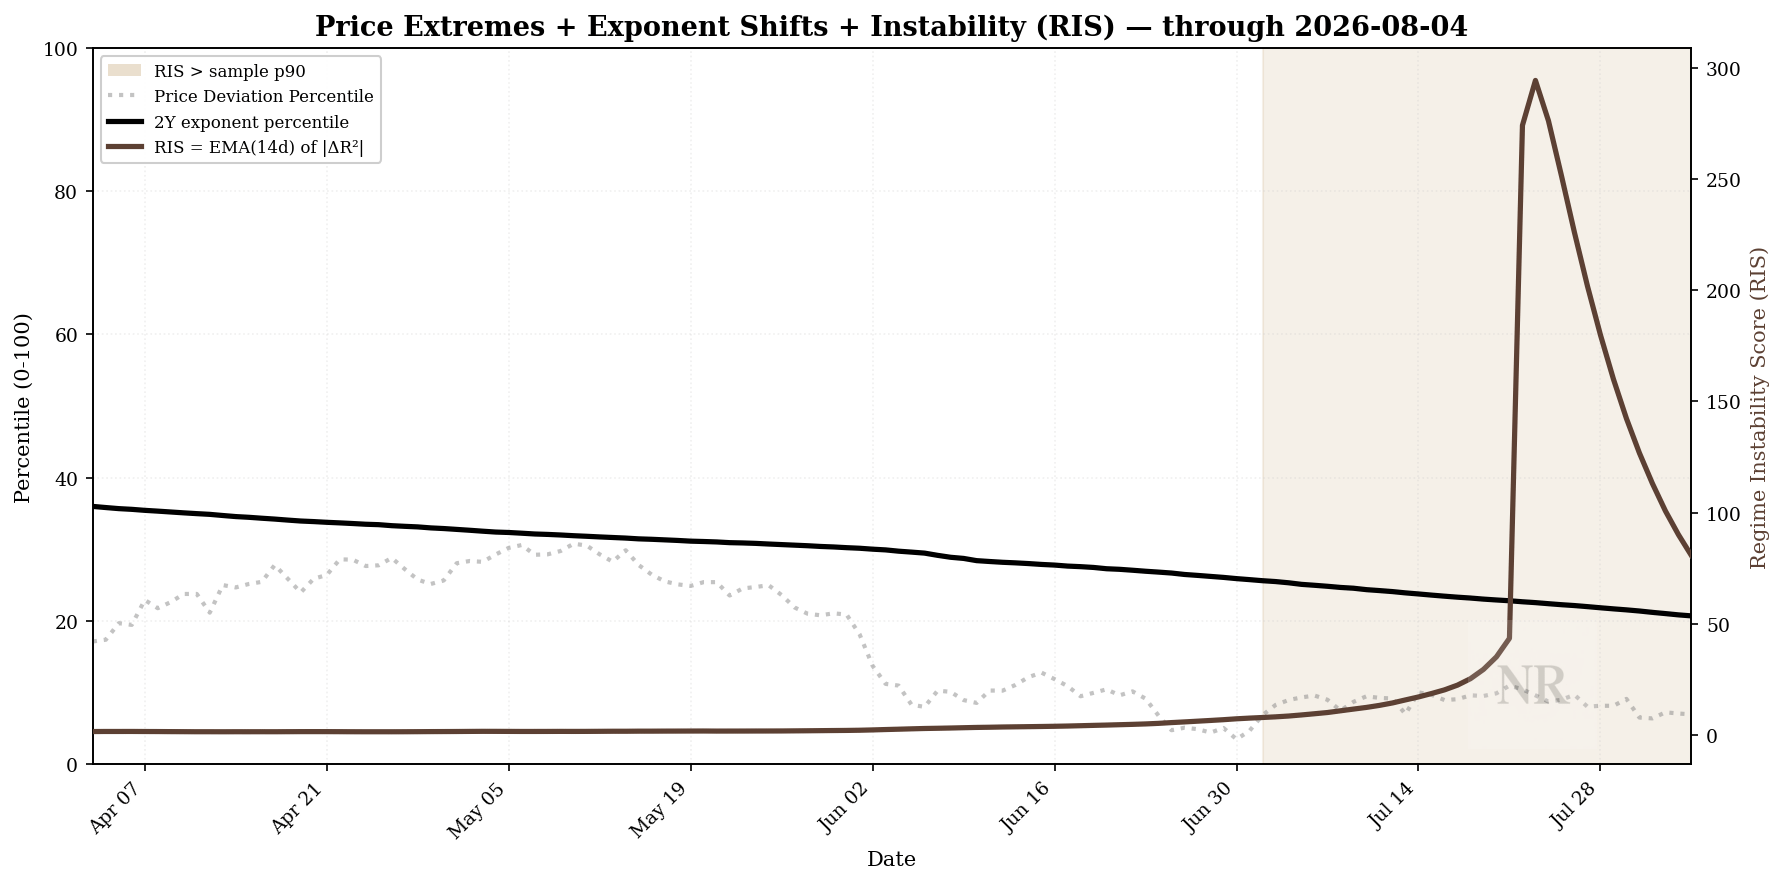
Today’s RIS reading is 80.7 (p97.7). That is down from the July 23 peak of ~294, but still firmly in the upper tail.
If RIS keeps decaying at its recent post-July-peak pace, it could cross back below p90 by mid-September. Don’t hold us to that, though. The real story is we’re likely still weeks, not days, from seeing this back at normal levels.
Transition Score: breached top 5%
In July we listed TS entering the historical top 5% as a condition to monitor. On June 30, TS came within 0.02 of the threshold.
That changed in July, where we saw our first breach since 2024.
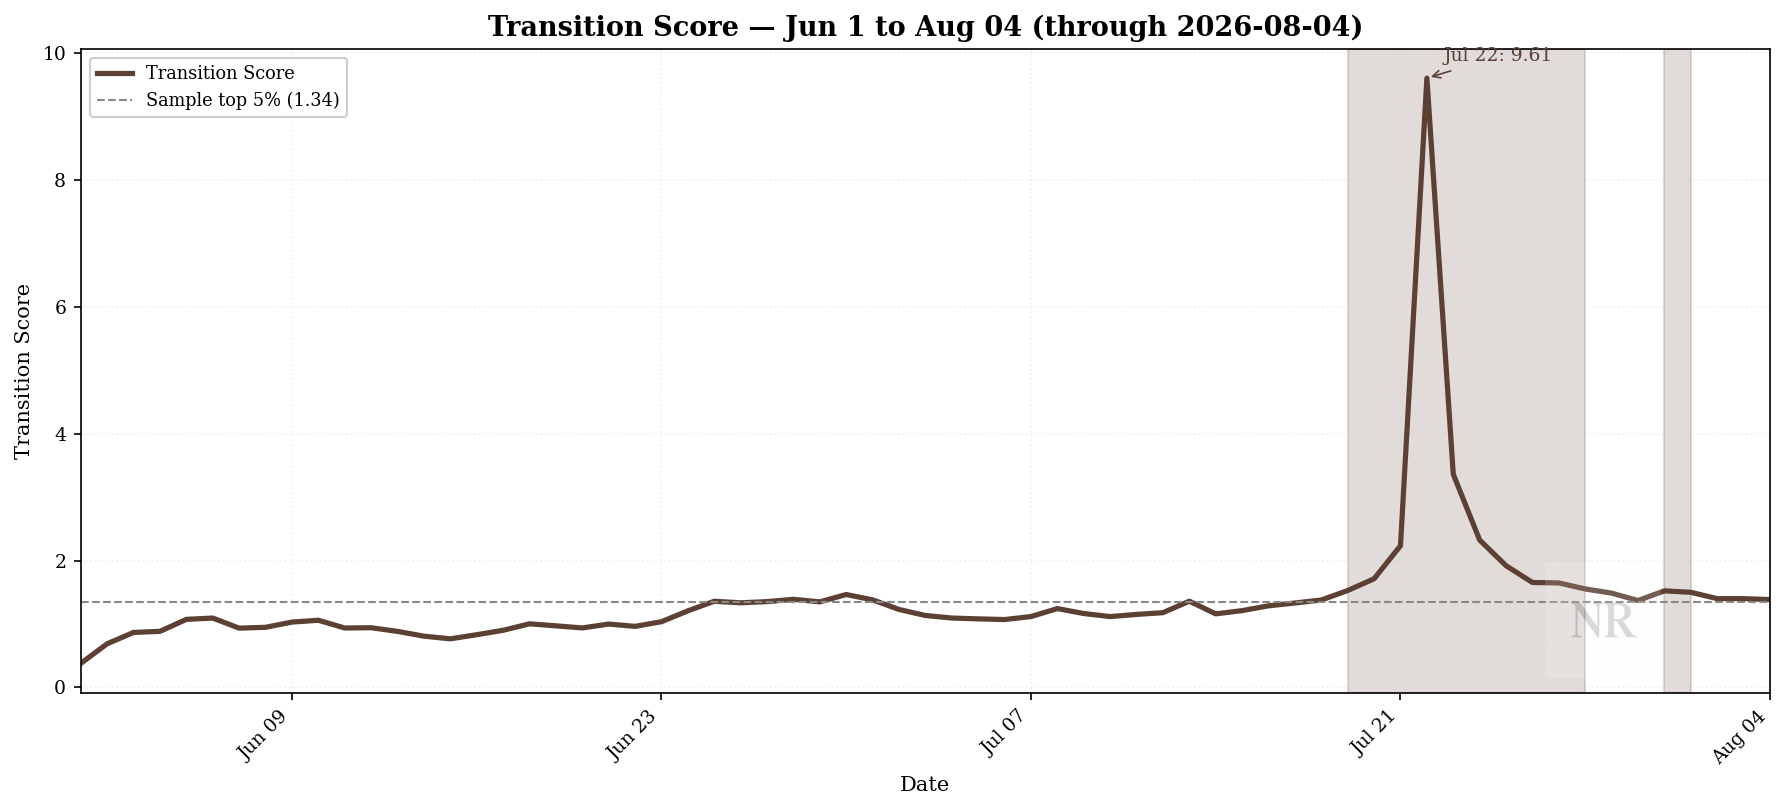
July 19: TS crossed into the top 5% for the first time this cycle.
July 22: TS peaked at 9.61 — the largest structural-stress reading in the upstream Foundations series.
July 19 – August 1: TS registered 12 sessions in the top 5% range before easing back below the threshold on August 2.
At today’s date, TS reads 1.38. This value is still elevated relative to the June baseline (~0.89), but no longer in the top 5%.
Outlook
Things we’re looking out for:
When does RIS make its turn back down? Thirty-six sessions above p90 is already longer than the initial July streak. Will our mid-September math hold up?
Does TS re-enter the top 5%? The July 22 spike may have been the cycle’s maximum stress event, or an opening act. We watch for whether sub-threshold readings persist or re-accelerate.
How long before 2Y exponent reverses trend? The 2Y β moved from +0.69 (July 5) to −0.51 (Aug 4 close). A reversal in that series would align with prior recovery episodes. Is price support on the way?
Conviction and Patience
Watch the structure and don’t be surprised. Keep on top of our latest research and support our work.
Don’t forget, now YOU can monitor the structure, using real Novara Research data!
Research infrastructure, not financial advice.